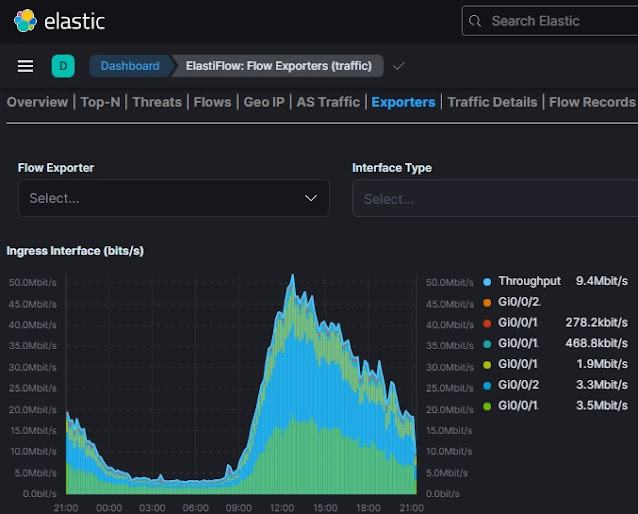
Time to time network engineers are facing the issue, when simple SNMP monitoring of interface load is not enough for the raised needs. Especially when network is experiencing DDoS attacks, or some kind of abnormal traffic flows are detected. So how to check what's going around. The answer is simple and almost as old as an IP protocol itself, visualization and further analysis with just implementation of Netflow functionality on border/core routers allowing to feed flow collector software.
With the introduction of flexible Netflow V9 which gives a lot of configuration options, engineers are given possibilities to have receive exact network traffic patterns view
Even the entry level routers from Cisco Systems running IOS-XE are capable for Netflow implementation.
To configure flexible Netflow on IOS-XE there's need for 3 main and one optional components:
1. "flow record", 2. "flow exporter", 3. "flow monitor" and optional "sampler".
"flow monitor" ties "flow record" and "flow exporter" together and then configuration can be attached to the interesting interface/sub-interface for input or output direction to collect transit traffic stats. Optional (but highly recommended) "sampler" gives possibility to randomly choose one packet from "x" count from the flow to avoid router and collector overload. e.g. 1 packet out of 1000 etc.
Additionally IPv6 support can be added to configuration if network runs dual stack of IPv4/IPv6.
Here we go with the most simple and complete configuration chunk, where flow destination IP address and port should be changed to the appropriate ones in individual network, also source interface for export must be chosen (usually Loopback0 if existing). Next flow monitor can be attached to any of the interesting interfaces.
!
flow record FLOW_RECORD_V4
match ipv4 tos
match ipv4 protocol
match ipv4 source address
match ipv4 destination address
match transport source-port
match transport destination-port
collect counter bytes long
collect counter packets long
collect interface input
!
flow exporter FLOW_EXPORTER
destination 192.168.100.10
source loopback0
transport udp 5555
export-protocol netflow-v9
option interface-table
option sampler-table
!
flow monitor FLOW-MONITOR
record FLOW_RECORD_V4
exporter FLOW_EXPORTER
cache timeout active 60
!
sampler FLOW_SAMPLER
mode random 1 out-of 1000
!
interface Gi0/0/0
ip flow monitor FLOW-MONITOR sampler FLOW_SAMPLER input
To check if everything works as expected:
router-xe#show flow monitor FLOW-MONITOR statistics
Cache type: Normal (Platform cache)
Cache size: 200000
Current entries: 96
High Watermark: 778
Flows added: 2568995
Flows aged: 2568899
- Active timeout ( 60 secs) 32661
- Inactive timeout ( 15 secs) 2536238
router-xe#show flow monitor FLOW-MONITOR cache
Cache type: Normal (Platform cache)
Cache size: 200000
Current entries: 100
High Watermark: 778
Flows added: 2569229
Flows aged: 2569129
- Active timeout ( 60 secs) 32664
- Inactive timeout ( 15 secs) 2536465
IPV4 SRC ADDR IPV4 DST ADDR TRNS SRC PORT TRNS DST PORT IP TOS IP PROT intf input bytes long pkts long
=============== =============== ============= ============= ====== ======= ==================== ==================== ====================
192.168.1.2 10.9.7.2 16610 8548 0x00 17 Gi0/0/0 400 2
192.168.1.3 10.9.7.3 18260 23830 0xB8 17 Gi0/0/0 400 2
192.168.1.4 10.9.7.4 41914 5060 0x00 17 Gi0/0/0 665 1
"option interface-table" feeds collector with interface names together with SNMP ifindex for convenient view.
"option sampler-table" gives collector hint of sampling ratio for correct multiply factor of bandwidth calculation and visualization.
ElastiFlow can be recommended as an open source software for a flow collector.
https://github.com/lsopromadze/netflowcollector-elk

